Performing Semantic Joins
Learn how to perform semantic table joins using the Project SEMA-JOIN interface.
Prerequisites: Complete Installation before proceeding.
Starting the Application
Start all services using Docker Compose:
# Run from project root (sema-join/)
make up
This starts:
- Backend API on port 8000
- Frontend web interface on port 3000
- MySQL database for application data
- Go service for PMI calculations on port 8080
Access the web interface by opening your browser and navigating to:
http://localhost:3000
Start Ollama AI service (optional, for AI features):
OLLAMA_HOST=0.0.0.0:11434 ollama serve
The Ollama service enables AI-powered column and row recommendations. The application works without it, but you'll need to manually select columns and review all candidate matches.
Other useful commands:
# Run from project root (sema-join/)
make down      # Stop all services
make restart   # Restart all services
make logs      # View service logs
Overview
When you first open the application, you'll see the SEMA-JOIN overview page explaining how the system works.
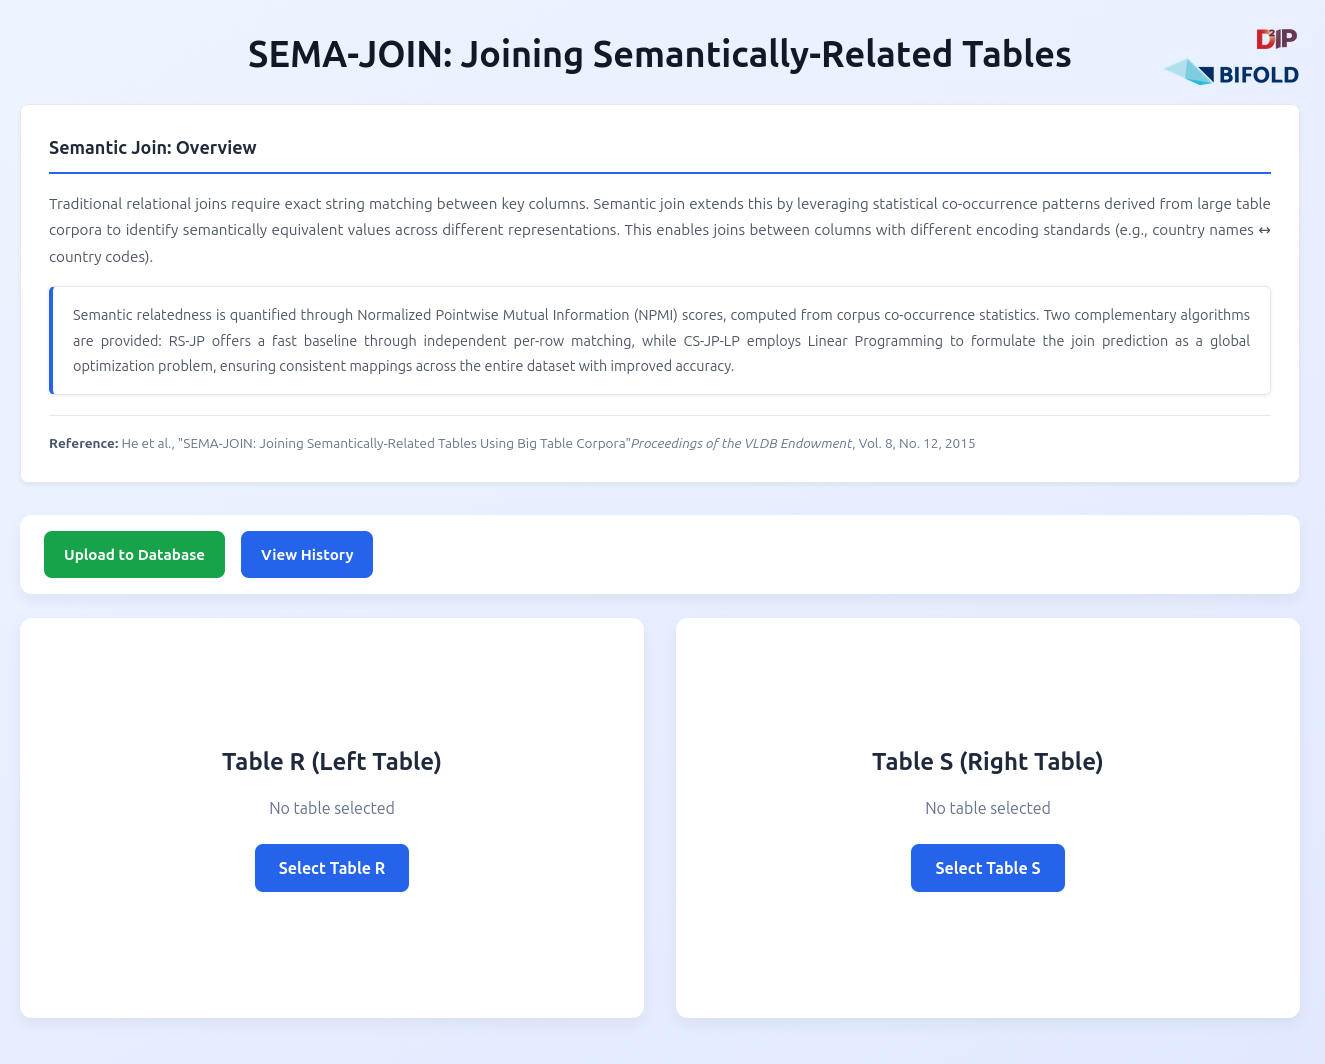
Two main options are available:
- Upload to Database - Add new tables to your database for joining
- View History - Review past join operations
The system uses semantic relationships based on statistical co-occurrence patterns from large table corpora to automatically determine how values should be joined, even when they use different representations (e.g., country names vs. country codes).
Uploading Tables to Database
Click "Upload to Database" to add tables to your database.
Upload Process
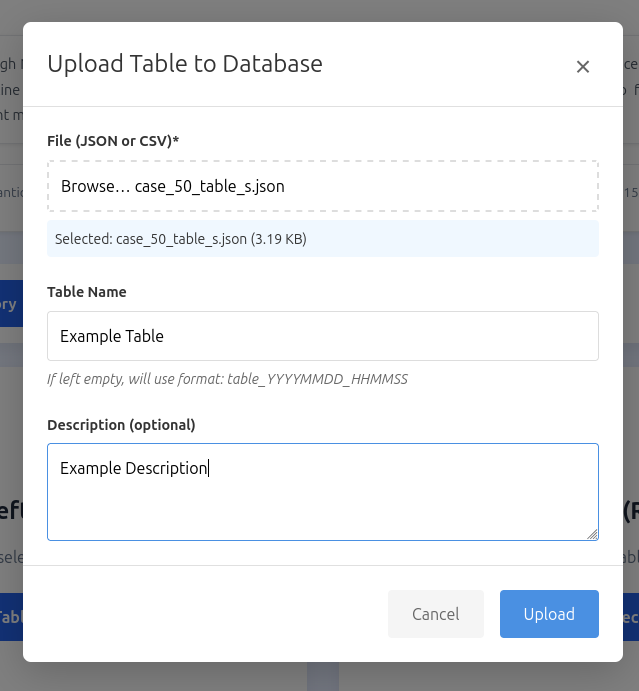
- Select your JSON or CSV file
- Optionally provide a descriptive name
- Optionally add a description
- Click upload
The table is stored in the database and can be reused for multiple join operations.
Table Format
Tables should be provided in JSON or CSV format. For JSON files, use an array of objects where each object represents a row, with keys as column names and values as the data.
Example JSON format (from /tables/case_1_table_s.json):
[
  {
    "continent": "Africa",
    "area_km2": 30370000,
    "countries_count": 54
  },
  {
    "continent": "Asia",
    "area_km2": 44579000,
    "countries_count": 48
  },
  {
    "continent": "Europe",
    "area_km2": 10180000,
    "countries_count": 44
  }
]
Example Tables: The project includes example table files in the /tables directory at the root of the project. You can use these to test semantic joins.
Selecting Tables from Database
After uploading tables, select which tables to join together.
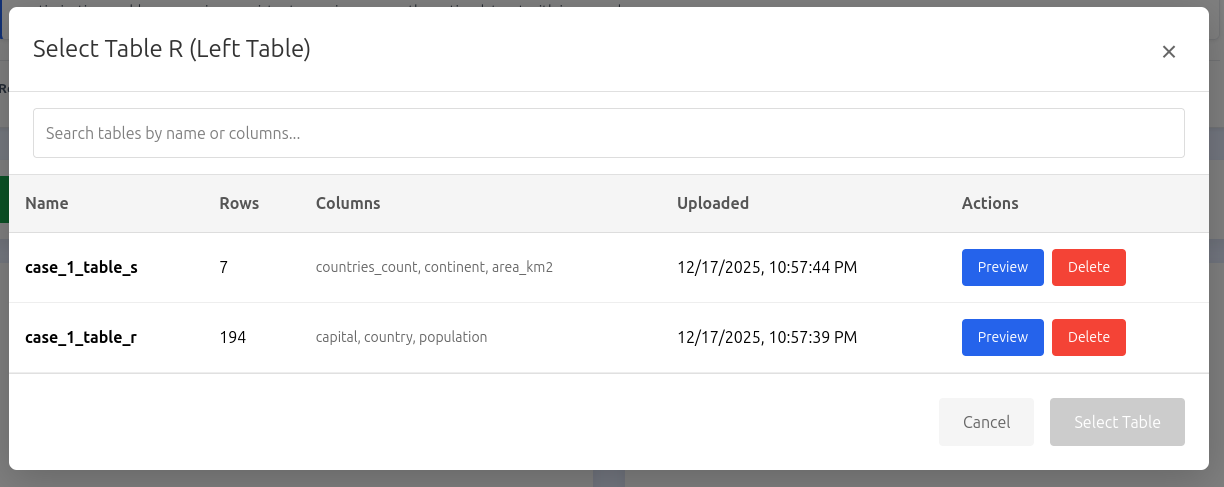
Click "Select Table R" (left table) or "Select Table S" (right table) to open the selection modal.
Features:
- Search - Filter tables by name or column names
- Preview - Click "Preview" to see the full table contents before selecting
- Delete - Remove tables you no longer need
Select a table by clicking its row, then click "Select Table" to confirm.
Selecting Join Columns
After loading both tables, you need to specify which columns to use for joining.
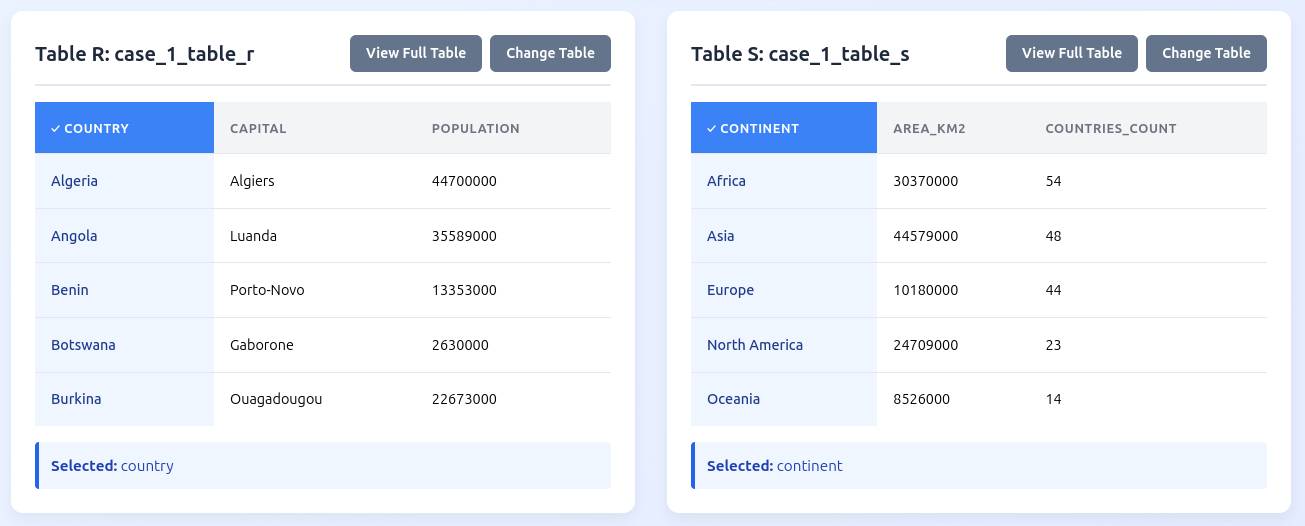
The tables display side-by-side, each showing the first few rows.
Manual Selection
Click any column header to select it as the join column. The selected column will be highlighted and shown at the bottom:
- Table R: "Selected: [column_name]"
- Table S: "Selected: [column_name]"
AI-Powered Column Suggestions
If the Ollama AI service is running, you can use automatic column suggestions.
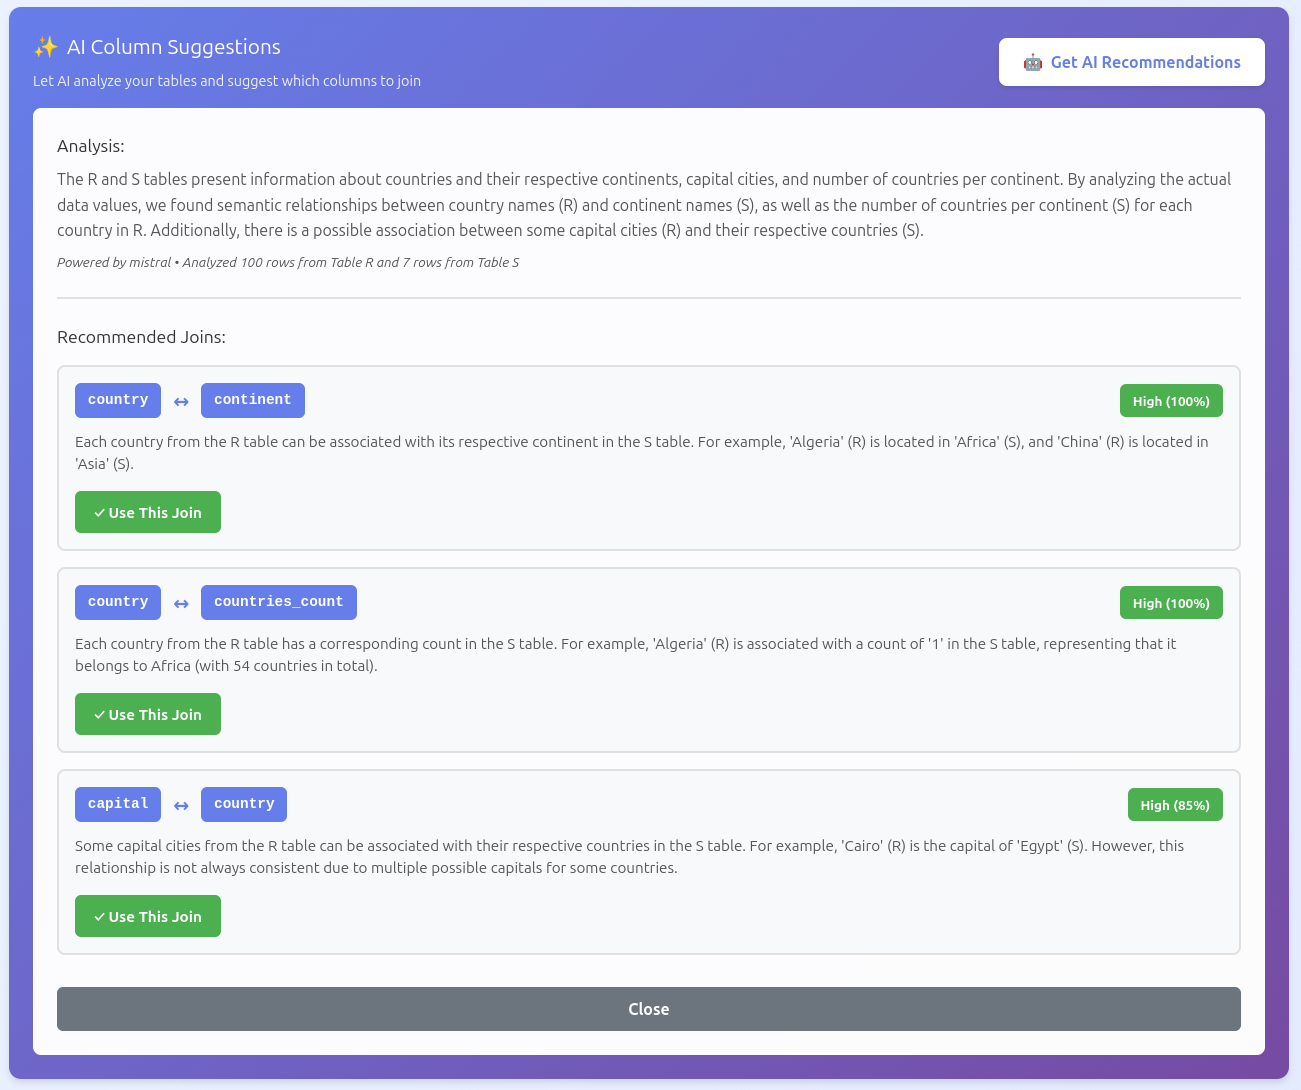
Click "Get AI Recommendations" to analyze both tables. The AI examines:
- Column names and data patterns
- Sample values from both tables
- Semantic relationships between columns
Recommendation Details:
- Confidence Level - High (0.8+), Medium (0.6-0.8), or Low (below 0.6)
- Suggested Column Pair - Shows which columns should be joined
- Explanation - Reason for the recommendation
- Overall Analysis - Context about the relationship between tables
Click "✓ Use This Join" to automatically select the suggested columns.
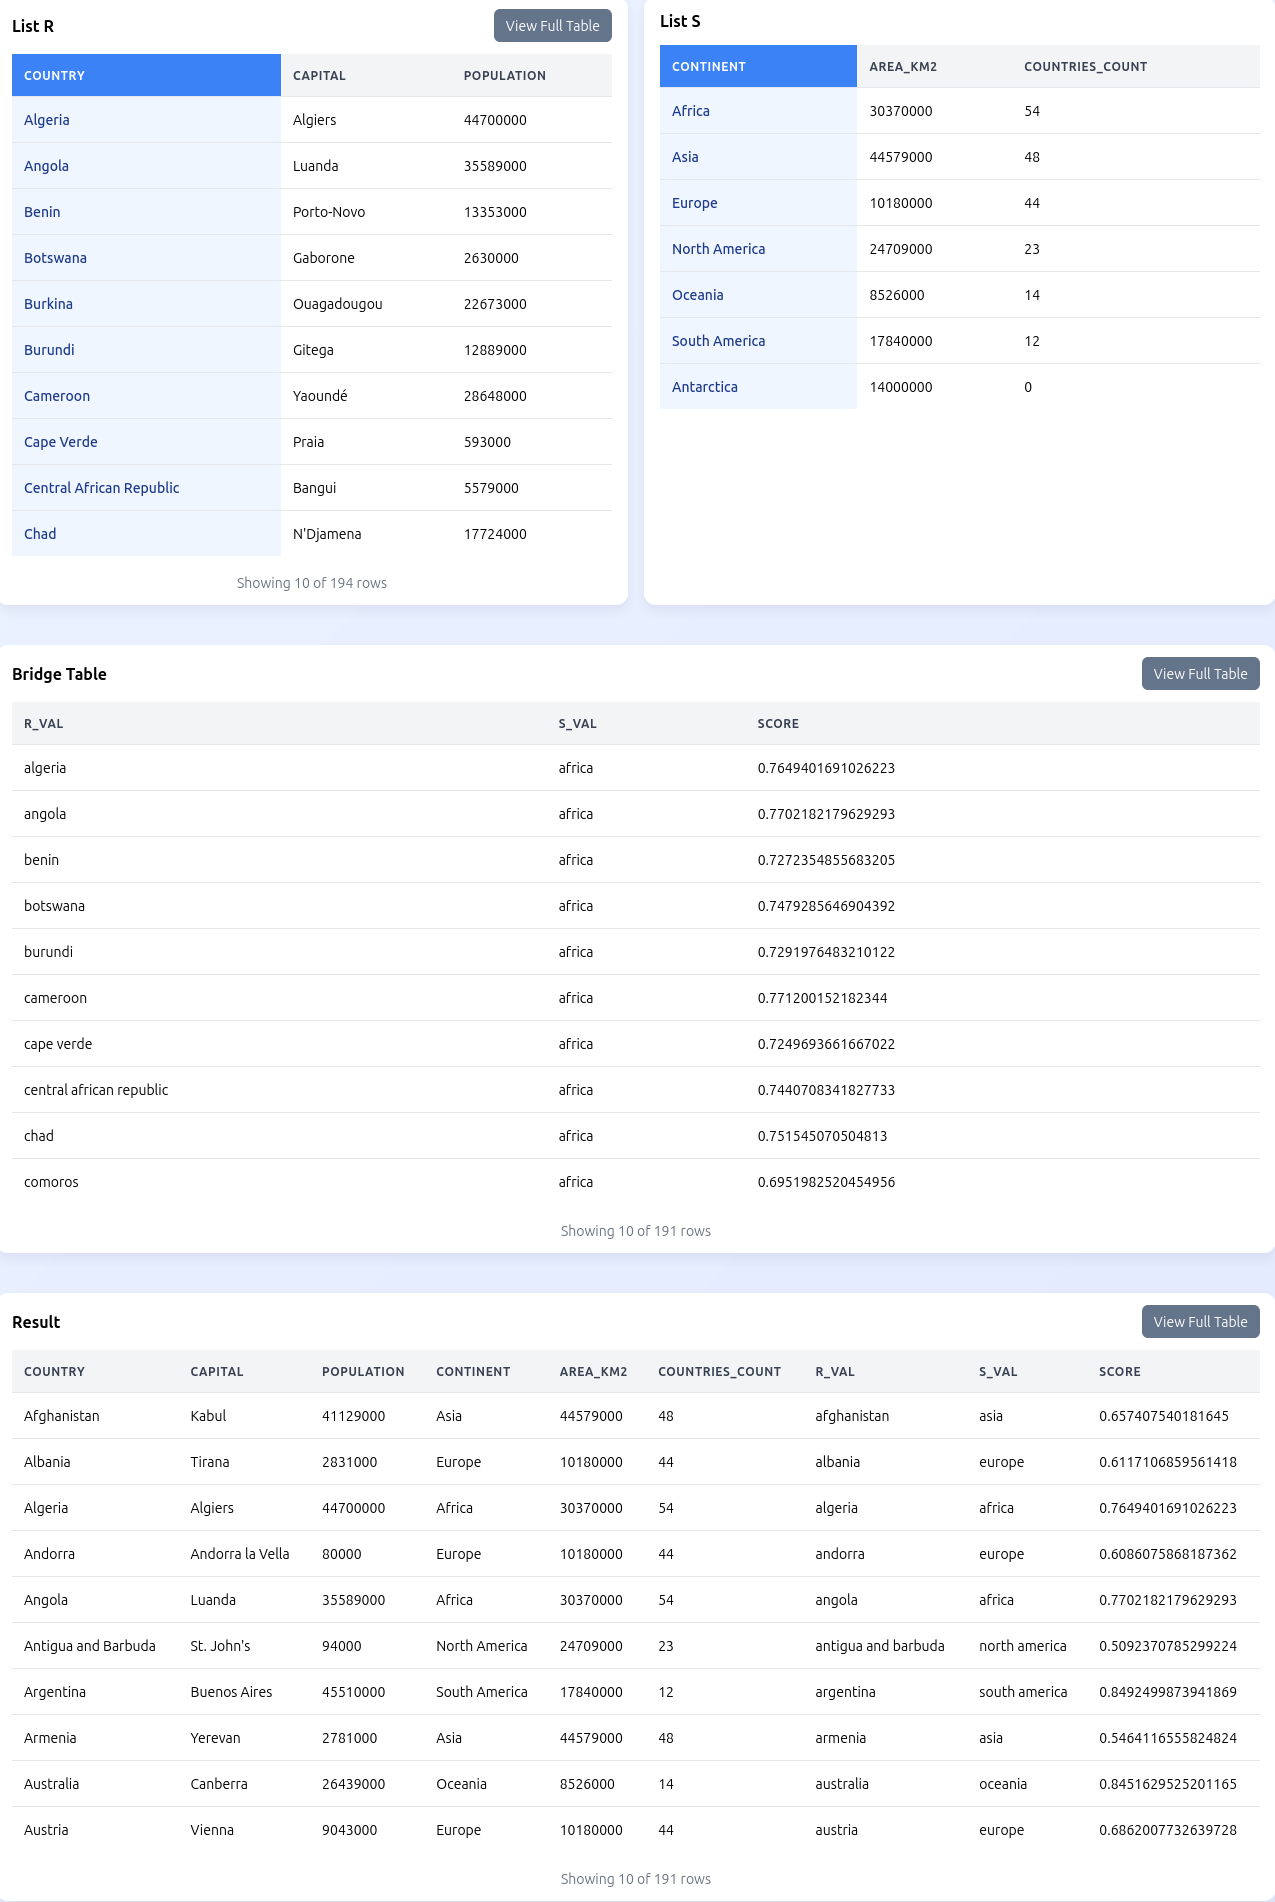
Creating the Bridge Table
The bridge table contains candidate matches between values from your selected columns.
Step 1: Choose Algorithm
Select one of two algorithms based on your needs:
RS-JP (Row Method)
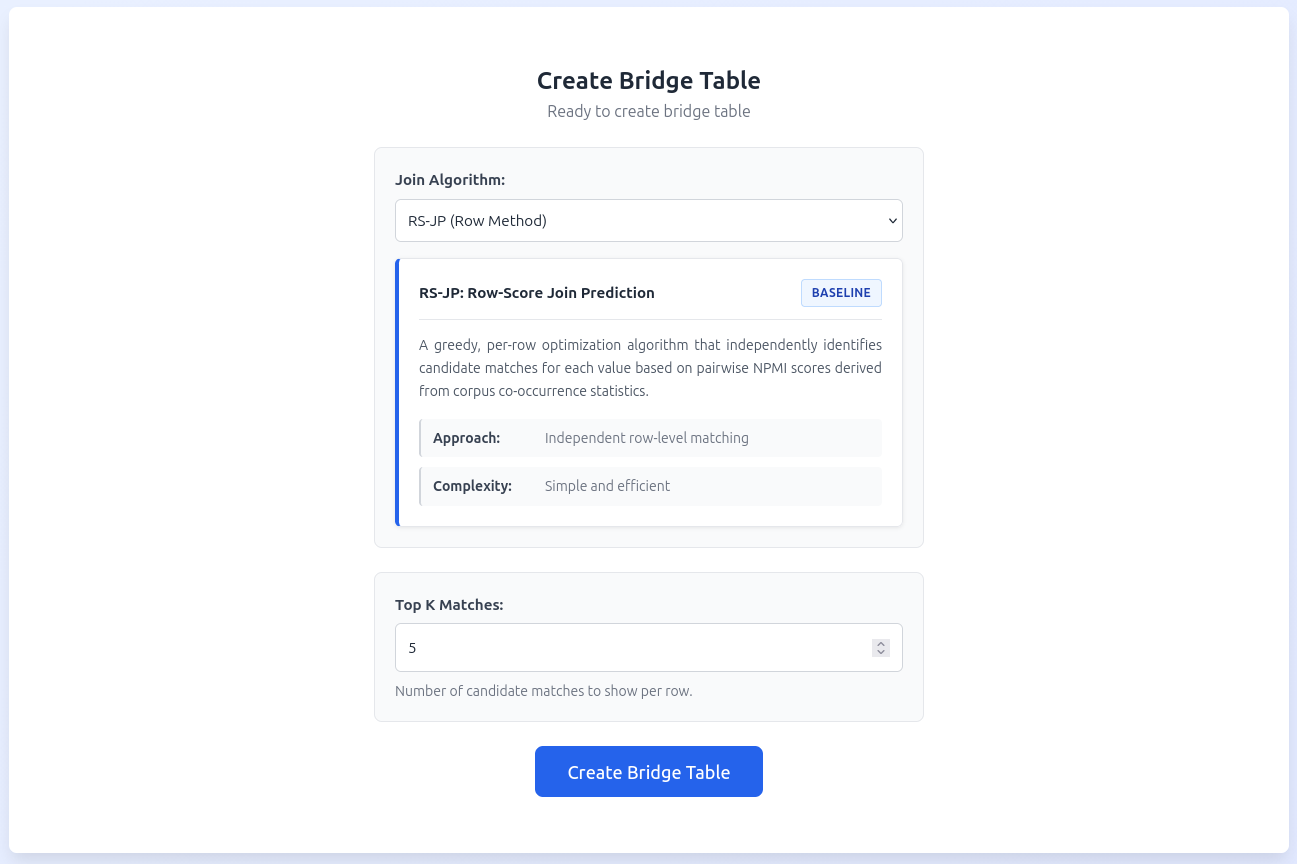
A greedy, per-row optimization algorithm that independently identifies candidate matches for each value based on pairwise scores derived from corpus co-occurrence statistics.
CS-JP-LP (Column Method)
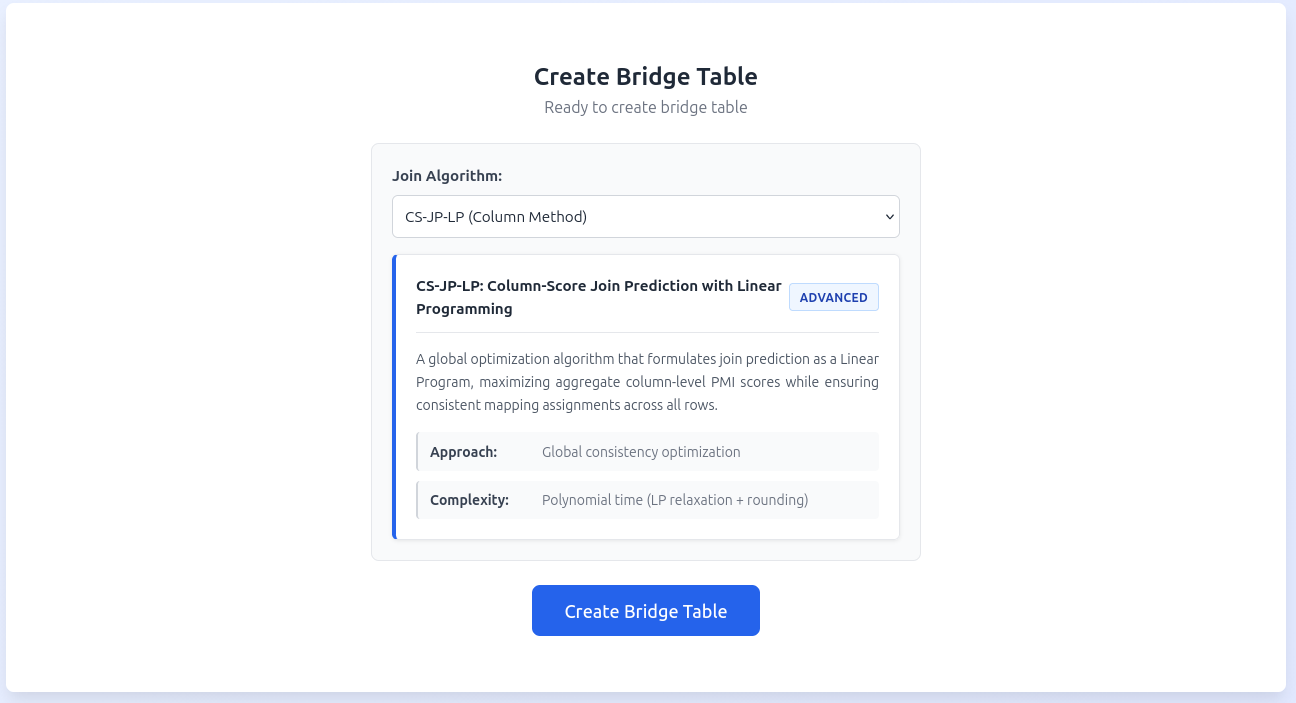
A global optimization algorithm that formulates join prediction as a Linear Program, maximizing aggregate column-level scores while ensuring consistent mapping assignments across all rows.
Step 2: Set Top K Matches
For RS-JP only, choose how many candidate matches to show for each value:
- K = 1: Automatically uses the best match for each value
- K > 1: Shows multiple candidates, allowing you to review and select
Note: CS-JP-LP always returns exactly one match per value (the globally optimal assignment).
Step 3: Create Bridge Table
Click "Create Bridge Table" to generate the matches. The system:
- Extracts values from your selected columns
- Queries the corpus database for co-occurrence statistics
- Calculates matching scores for potential value pairs
- Returns candidate matches with their scores
Step 4: AI Row Recommendations (Optional)
If you're using RS-JP with K > 1, you can get AI help selecting the best matches.
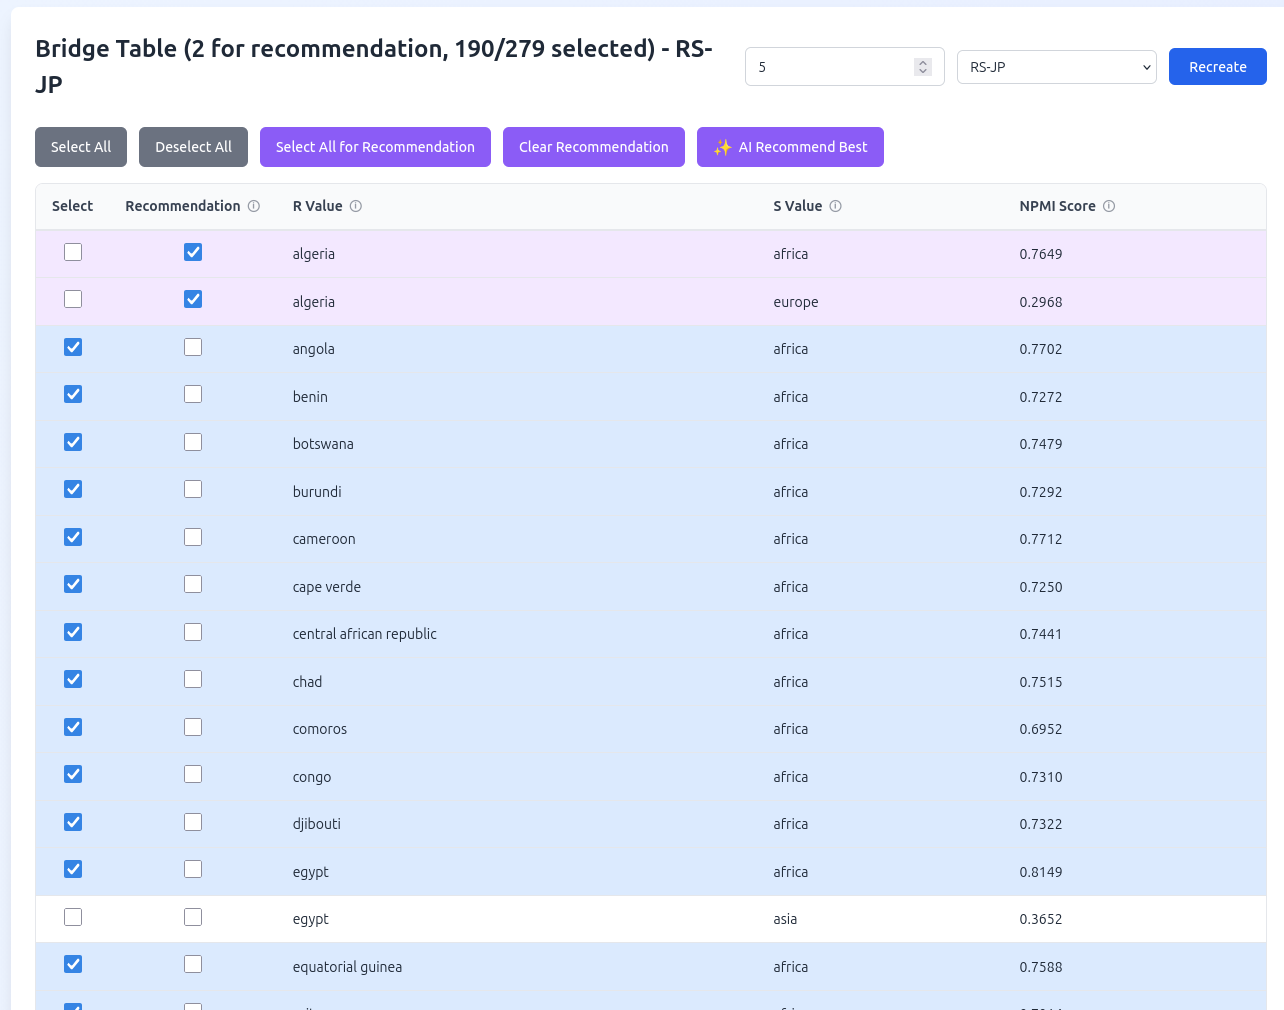
The bridge table shows:
- Select column - Checkboxes for entries to include in the final join
- Recommendation column - Checkboxes to mark entries for AI analysis
- R Value - Value from Table R
- S Value - Candidate match from Table S
- Score - Match strength (higher is better)
Using AI Recommendations:
- Check boxes in the "Recommendation" column for entries you want AI to analyze
- Click "AI Recommend Best" button
- The AI evaluates all candidates and selects the best match for each R value
- Results update the "Select" column automatically
- You can still manually adjust selections afterward
Bulk Actions:
- "Select All for Recommendation" - Mark all entries for AI analysis
- "Clear Recommendation" - Uncheck all recommendation boxes
- "Select All" / "Deselect All" - Manage which entries will be used in the join
Step 5: Manual Review
Review the bridge table and adjust selections as needed. By default:
- RS-JP: Best match (highest score) per R value is auto-selected
- CS-JP-LP: All entries are selected (optimal solution)
You can change selections before performing the join.
Performing the Join
Once you've created and reviewed your bridge table:
- Click "Join Tables"
- The system performs a three-way join: Table R → Bridge Table → Table S
- Results show combined data from both original tables
Viewing Results
The joined result displays all matched records.
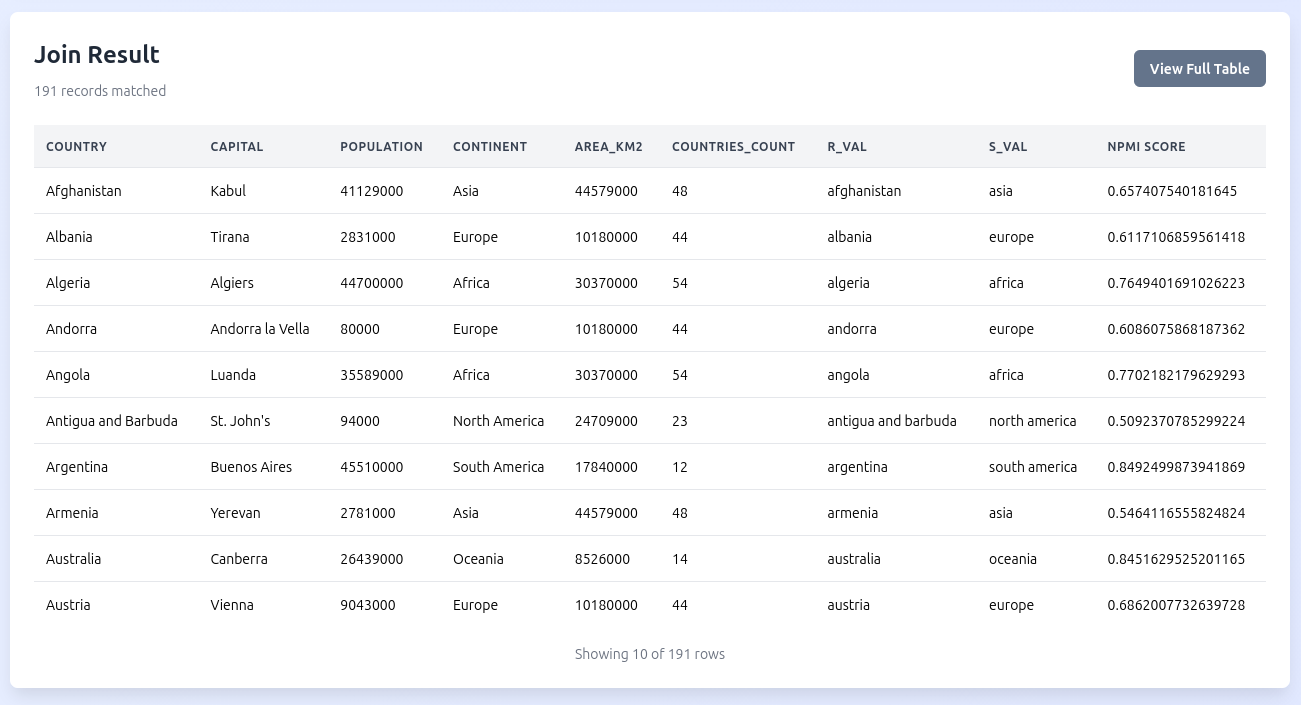
The result table includes:
- All columns from Table R
- Bridge table columns (matching values and scores)
- All columns from Table S
- Only rows where matches were found
You can review the results to verify they meet your expectations.
Viewing History
Click "View History" from the home page to see past join operations.
The history page shows:
- Top section: Past joins showing timestamp and columns used
- Middle section: Bridge table used for the selected join
- Bottom section: Details of previous table selections and configurations
You now have a complete understanding of how to use Project SEMA-JOIN for semantic table joins. Experiment with different tables, algorithms, and AI features to find the best approach for your data integration needs.